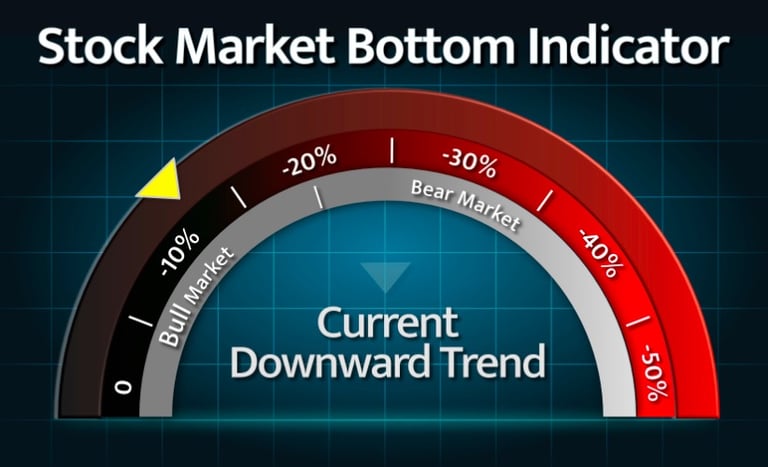
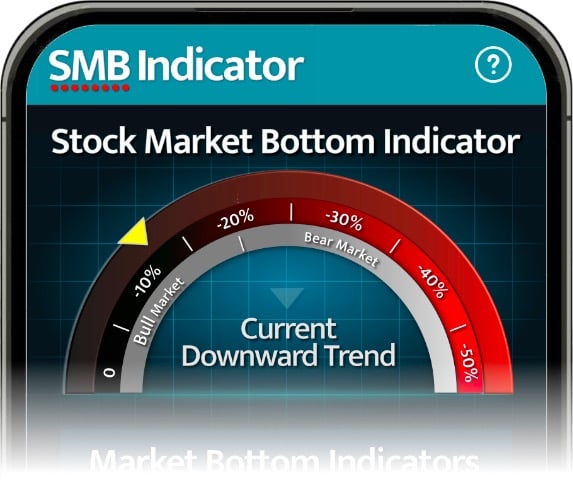
Stock Market Bottom Indicator tracks downward stock market momentum.
The Stock Market Bottom Indicator (SMB Indicator) provides valuable insights into the current downward trend in the total U.S. stock market. The SMB Indicator is updated daily and provides a comprehensive overview of the current level of decline of the entire stock market.

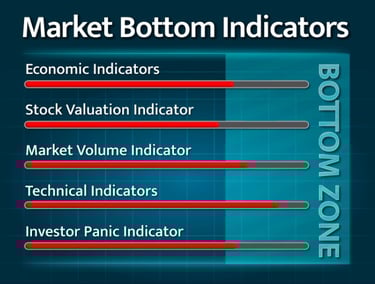
The Market Bottom Indicators monitor the market to identify a potential bottom.
The Market Bottom Indicators closely monitor the overall stock market to identify a potential bottoming pattern. When all five of the indicators simultaneously reach the Bottom Zone and at least one of them reaches its maximum value, it signals the likelihood of a stock market bottom.

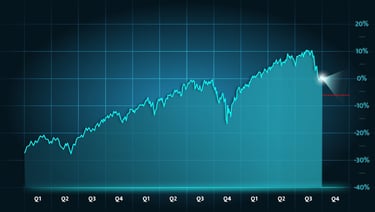
The quarterly market forecast with lower support level.
The Market Support Level chart depicts the resistance level of the market’s current downward trend. The Market Support Level chart illustrates the next most likely level of support for the entire stock market. It highlights the next potential support level, which could serve as a catalyst for the market’s next upward trend.
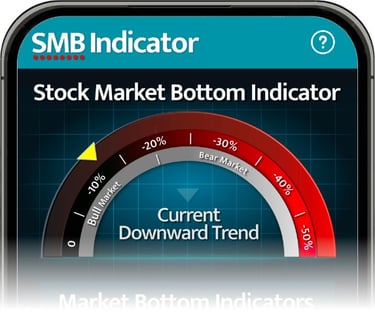
Stock Market Bottom Indicator is available on your favorite app store.
Download the SMB Indicator from your favorite App Store today.